
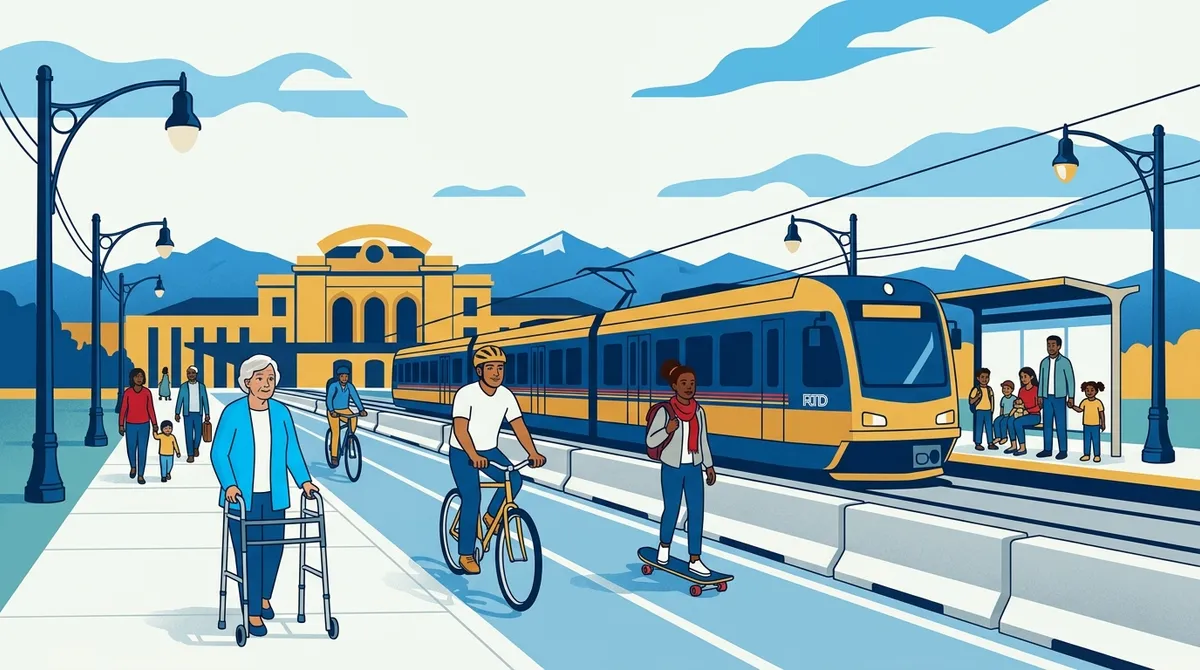
Transportation & Public Transit
Free RTD transit for low-income residents. Protected bike lanes on every major corridor. Vision Zero with real enforcement. Parking reform to reduce housing costs. Transit equity for underserved neighborhoods. 15-minute city framework so every Denverite can reach daily needs on foot or bike.
- Drafted
- Organizing
- Introduced
- Committee
- Enacted
ችግሩ
እ.ኤ.አ በ2004 የዴንቨር አካባቢ መራጮች በመላ ሜትሮ አካባቢ ሁሉን አቀፍ የባቡር ትራንዚት ሲስተም ለመገንባት የ$4.7 ቢሊዮን ዶላር ፋስትትራክስን (FasTracks) እቅድ አጽድቀዋል። ከሃያ አመታት በኋላ ፕሮግራሙ 75% ብቻ የተጠናቀቀ ሲሆን ከ$5.5 ቢሊዮን ዶላር በላይ ፈጅቷል። RTD አራቱን የቀሩ ኮሪደሮችን (ወደ ሎንግሞንት የሚወስደውን ሰሜን ምዕራብ ባቡር፣ የሰሜን ሜትሮ ኤክስቴንሽን፣ ወደ ሃይላንድስ ራንች የሚወስደውን የደቡብ ምዕራብ ኤክስቴንሽን እና ሴንትራል ሬይል ጋፕን) ለማጠናቀቅ ተጨማሪ $1.6 ቢሊዮን ዶላር እንደሚያስፈልገው ገምቷል፣ እንዲሁም አዲስ የገንዘብ ድጋፍ ከሌለ በክልሉ የተደነገገውን የ2034 የጊዜ ገደብ ማሟላት እንደማይችል አምኗል (RTD Finishing FasTracks Report, 2025)። ይህ በእንዲህ እንዳለ፣ RTD በ104 ማይል ትራኮች ላይ ለሚደረግ ጥገና ከ$100 ሚሊዮን እስከ $400 ሚሊዮን ዶላር የሚደርስ የገንዘብ እጥረት እየገጠመው ሲሆን ቦርዱ በ2027 አገልግሎት ላይ ቅነሳ ለማድረግ እያሰበ ነው። መራጮች የአለም ደረጃውን የጠበቀ የትራንዚት ሲስተም ከፍለዋል። ያገኙት የተሰበረ ተስፋ እና እየቀነሰ ያለ አገልግሎት ነው።
ተሳፋሪዎች ታሪኩን ይናገራሉ። RTD በ2019 105.8 ሚሊዮን ተሳፋሪዎችን አጓጉዟል። በ2024 ይህ ቁጥር 65.2 ሚሊዮን የነበረ ሲሆን ይህም የ38 በመቶ ቅናሽ አሳይቷል። እ.ኤ.አ በ2025 የመጀመሪያ አጋማሽ የተሳፋሪዎች ቁጥር በሌላ 6.4 በመቶ ቀንሷል፣ ይህም ከመከሰቱ በፊት ከነበረው በ39 በመቶ በታች ነው (Denver Post, October 2025)። እንደ ሎስ አንጀለስ፣ ሂውስተን እና ሶልት ሌክ ሲቲ ያሉ ከተሞች ከመከሰቱ በፊት የነበረውን የ85% ወይም ከዚያ በላይ መልሰዋል። ዴንቨር በ62% አካባቢ ቆሟል። እያንዳንዱ የ RTD ተሳፋሪ ኤጀንሲውን በስራ ማስኬጃ ወጪ $17.49 ያስወጣል፣ የሶስት ሰአት ትኬት ደግሞ በ$2.75 ይሸጣል። ስሌቱ አይሰራም፣ እና ሽክርክሪቱ ቀጥሏል፡ ያነሱ ተሳፋሪዎች ማለት ያነሰ ገቢ ማለት ነው፣ ይህ ማለት ደግሞ የባሰ አገልግሎት ማለት ነው፣ ይህ ማለት ደግሞ ያነሱ ተሳፋሪዎች ማለት ነው።
ዴንቨር እ.ኤ.አ በ2017 ቪዥን ዜሮን (Vision Zero) የተቀበለች ሲሆን እስከ 2030 ድረስ የትራፊክ አደጋዎችን እና ከባድ ጉዳቶችን ለማስወገድ ቃል ገብታለች። ነገር ግን ከዚያን ጊዜ ጀምሮ የአደጋዎች ቁጥር በተቃራኒ አቅጣጫ እየሄደ ነው። እ.ኤ.አ በ2025 በዴንቨር ጎዳናዎች ላይ 93 ሰዎች የሞቱ ሲሆን ይህም ከ2013 ጀምሮ የከፋ አመት ነው። ከእነዚህ ሞት ውስጥ ሰላሳ አምስቱ እግረኞች ሲሆኑ ይህም ከ2024 በ34 በመቶ ብልጫ አለው (Denver Vision Zero Dashboard, 2025)። የዴንቨር ጎዳናዎች የተነደፉት ለመኪና ፍጥነት እንጂ ለሰው ደህንነት አይደለም። ከ81% በላይ የሚሆኑ የዴንቨር መንገደኞች ብቻቸውን ይነዳሉ። አሽከርካሪዎች እ.ኤ.አ በ2024 በትራፊክ ውስጥ በአማካይ 76 ሰአታት አሳልፈዋል (ይህም በ2019 ከነበረው 62 ሰአታት ጨምሯል) ይህም ክልሉን በዓመት $3.5 ቢሊዮን ዶላር ምርታማነት እና ነዳጅ በማባከን አስከፍሏል (Texas A&M Transportation Institute, 2025)። እንደ ሞንትቤሎ፣ ግሪን ቫሊ ራንች፣ ፋር ሰሜን ምስራቅ እና ዌስትዉድ ባሉ ሰፈሮች፣ ነዋሪዎች የመኪና ጥገኛ የጎዳና ላይ ዲዛይን በቂ ያልሆነ የትራንዚት አገልግሎት ይገጥማቸዋል። RTD ወደ ኤርፖርት የሚወስደውን ኤ መስመር ሲገነባ ሞንትቤሎን በማለፍ የአውቶቡስ መስመሮችን በመቁረጥ ሰፈሩን ከሰባት የትራንዚት መስመሮች ወደ ሶስት ዝቅ አደረገው። ሞንትቤሎ በተመሳሳይ ጊዜ የትራንዚት በረሃ እና የምግብ በረሃ ሆነ (Denver Streets Partnership)።
ዴንቨር በአሁኑ ጊዜ ምን እያደረገች ነው
RTD 65 የአውቶቡስ መስመሮችን፣ 8 የባቡር መስመሮችን እና የፍሌክስ ራይድ (FlexRide) እና የዴንቨር ኮኔክተርን (Denver Connector) የማይክሮትራንዚት አገልግሎቶችን ያስተዳድራል። ፋስትትራክስ 25 ማይል የብርሃን ባቡር፣ 53 ማይል የተሳፋሪ ባቡር፣ የዴንቨር ዩኒየን ጣቢያን እንደ ኢንተርሞዳል ማዕከል እና የፍላትሮን በራሪ (Flatiron Flyer) BRT በ US-36 ላይ አስረክቧል። ነገር ግን አራቱ ኮሪደሮች ገና አልተገነቡም፣ እና የአስቸኳይ ጊዜ ትራክ ጥገናዎች (የ$152 ሚሊዮን ዶላር ዳውንታውን መልሶ ግንባታን ጨምሮ) ከአንድ አመት በላይ አገልግሎቱን አቋርጠዋል። RTD በጁላይ 2024 ከ19 አመት በታች ላሉ ወጣቶች ነፃ የጉዞ አገልግሎት በመስጠት ዜሮ ፋሬ ፎር ዩዝ (Zero Fare for Youth) ፕሮግራሙን በቋሚነት ያደረገ ሲሆን የፌደራል የድህነት ደረጃ ከ250 በመቶ በታች ገቢ ላላቸው ግለሰቦች የ50% ቅናሽ በማድረግ የ LiVE የገቢ-ተኮር የቅናሽ ፕሮግራሙን አስፋፍቷል።
ዴንቨር እ.ኤ.አ በ2017 ቪዥን ዜሮ አክሽን ፕላንን (Vision Zero Action Plan) የፀደቀች ሲሆን በ2022 አዘምነዋለች። ከፀደቀ በኋላ አመታዊ የትራፊክ ሞት ከ51 ወደ 93 ከፍ ብሏል። ከተማዋ በጣም አደገኛ የሆኑ ኮሪደሮችን በመለየት ከፍተኛ የአደጋ ኔትወርክን አዘጋጅታለች ነገር ግን እነሱን እንደገና ለመንደፍ ቀርፋፋ ነች። አውቶሜትድ የፍጥነት ማስከበር አሁንም የተገደበ ነው።
የዴንቨር የትራንስፖርት እና መሠረተ ልማት ዲፓርትመንት (DOTI) በግምት 254 ማይል የብስክሌት መስመሮችን ያስተዳድራል። ከንቲባ ሃንኮክ (Hancock) በ2018 እና 2023 መካከል 137 ማይል አዲስ የብስክሌት መስመሮችን በ$13.4 ሚሊዮን ዶላር ወጪ ጨምረዋል። ከንቲባ ጆንስተን አስተዳደር (Johnston’s administration) 230+ አዲስ ማይል የብስክሌት መንገዶችን እና እያንዳንዱ ቤተሰብ ከአንድ ሩብ ማይል ርቀት ላይ ከፍተኛ ምቾት ያለው የብስክሌት መንገድ የማስቀመጥ ግብን ይዞ ዴንቨር ሙቭስ፡ ባይክስን (Denver Moves: Bikes) እያዘመነ ነው። ከተማዋ እስከ 2026 ድረስ 50 ማይል አዲስ የብስክሌት መስመሮችን ለመገንባት ቃል ገብታለች። በ18ኛው፣ 19ኛው እና ሊንከን ጎዳናዎች ላይ ያሉ ፕሮጀክቶች በከተማው መሀል 1.5 ማይል የተጠበቁ መስመሮችን እየጨመሩ ነው፣ ነገር ግን በተለይም በምስራቅ ዴንቨር እና ካፒቶል ሂል ላይ ጉልህ ክፍተቶች አሉ።
በመራጮች የፀደቀው የአየር ንብረት ጥበቃ ፈንድ የገንዘብ ድጋፍ ያደረገው የዴንቨር የኢ-ቢስክሌት (e-bike) የቅናሽ ፕሮግራም እ.ኤ.አ በ2022 ከተጀመረ ጀምሮ $8.6 ሚሊዮን ዶላር ኢንቨስት አድርጓል። ወደ 8,000 የሚጠጉ ነዋሪዎች ቫውቸሮችን የወሰዱ ሲሆን 64% የሚሆኑት ዝቅተኛ እና መካከለኛ ገቢ ላላቸው ነዋሪዎች ነው። የቅናሽ መጠኖች ከመደበኛ ኢ-ቢስክሌቶች (e-bikes) ለ$300 እስከ ለአዳፕቲቭ ኢ-ቢስክሌቶች (adaptive e-bikes) $1,400 ይደርሳል። የኮሎራዶ ግዛት ተጨማሪ $450 የታክስ ክሬዲት ይሰጣል (እ.ኤ.አ በ2026 ወደ $225 ዝቅ ይላል)።
እ.ኤ.አ በነሐሴ 2025 የዴንቨር ከተማ ምክር ቤት ለመልቲፋሚሊ መኖሪያ ቤቶች በአቅራቢያ ትራንዚት (HB24-1304) የመኪና ማቆሚያ ዝቅተኛ መስፈርቶችን የከለከለውን የግዛት ህግ ተከትሎ ለአዳዲስ ልማት ዝቅተኛ የመኪና ማቆሚያ መስፈርቶችን ለማስወገድ ድምጽ ሰጥቷል። ይህ ትልቅ እርምጃ ነበር፣ ነገር ግን ሰፋ ያለ የትራንስፖርት ስርዓት በመሠረቱ በመኪና ላይ የተመሰረተ ነው።
የእኛ መፍትሔ
1. ነፃ እና የተቀነሰ ዋጋ ያለው ትራንዚት
የ RTD LiVE ፕሮግራም ጅምር ነው። በቂ አይደለም። የሚከተሉትን እንመክራለን፡-
- ከፌደራል የድህነት ደረጃ 200% በታች ላሉ ቤተሰቦች በሙሉ ነፃ RTD። የአሁኑ የ LiVE ፕሮግራም 250% FPL የሚሸፍነው በ50% ቅናሽ ብቻ ነው። በእርግጥ ዝቅተኛ ገቢ ያላቸው ነዋሪዎች አሁንም መግዛት ለማይችሉት የዋጋ ግማሽ ሳይሆን ዜሮ ዋጋ ያለው አገልግሎት ያስፈልጋቸዋል።
- ለአካባቢው መስመሮች በሙሉ $1 ቋሚ ዋጋ፣ የአሁኑን የ$2.75 የሶስት ሰዓት ትኬትን በቀላል፣ ተመጣጣኝ ዋጋ በመተካት ለመጓጓዣ እንቅፋቶችን ያስወግዳል።
- በአመት በግምት $30-40 ሚሊዮን ዶላር ለ RTD በከተማ ድጎማ የሚሸፈን። ዴንቨር መኪናዎችን በማስተናገድ በቢሊዮኖች የሚቆጠር ገንዘብ ታወጣለች። ትራንዚትን ተደራሽ ለማድረግ $35 ሚሊዮን ዶላር ማውጣት ሲነጻጸር ስህተት ነው።
- በካንሳስ ሲቲ፣ ሚዙሪ ሞዴል የተሰራ፣ እ.ኤ.አ በ2020 ዋጋዎችን በሙሉ ያስወገደች ሲሆን ይህም በዩኤስ ውስጥ ትልቁ የነፃ ትራንዚት ከተማ አድርጓታል። የካንሳስ ሲቲ የአውቶቡስ ተሳፋሪዎች አሁን ከእኩዮቻቸው ከተሞች በ24% ከፍ ያለ ነው፣ 17% ተሳፋሪዎች ለአገልግሎቱ አዲስ ናቸው፣ እና 92% ተሳፋሪዎች አስፈላጊ ነገሮችን መግዛት እና ስራቸውን ማቆየት እንደሚችሉ ይናገራሉ (University of Kansas, 2025)። ሉክሰምበርግ እ.ኤ.አ በ2020 በሀገር አቀፍ ደረጃ ሁሉንም የህዝብ ማመላለሻ ዋጋዎችን አስወግዳለች።
2. የተጠበቀ የብስክሌት ሌይን ኔትወርክ
በአስፋልት ላይ ቀለም መሠረተ ልማት አይደለም። ዴንቨር ሁሉም ዕድሜ እና ችሎታ ያላቸው ሰዎች በደህና የሚጠቀሙባቸው በአካል የተጠበቁ የብስክሌት መስመሮች ያስፈልጋታል።
- በአምስት ዓመታት ውስጥ በእያንዳንዱ ዋና ኮሪደር ላይ የተጠበቁ የብስክሌት መስመሮች። በ Vision Zero High Injury Network በተለዩ ከፍተኛ የብልሽት ኮሪደሮች እና ከባቡር ጣቢያዎች እና ከአውቶቡስ ማዕከሎች ጋር ግንኙነቶች ላይ ቅድሚያ ይሰጣል።
- ለአዳዲስ ልማት የብስክሌት ማቆሚያ መስፈርቶች፡- በእያንዳንዱ አዲስ የመኖሪያ እና የንግድ ህንፃ ውስጥ ደህንነቱ የተጠበቀ፣ የተሸፈነ የብስክሌት ማቆሚያ።
- የኢ-ቢስክሌት (E-bike) ቅናሽ ማስፋፊያ፡- የገንዘብ ድጋፍን መጨመር፣ የገቢ ብቁ ቅናሾችን ወደ $1,200 ከፍ ማድረግ እና በቀጥታ ለመድረስ አነስተኛ አገልግሎት በሚያገኙ ሰፈሮች ውስጥ ካሉ የህብረተሰብ ድርጅቶች ጋር መተባበር። የአሁኑ ፕሮግራም ይሰራል ነገር ግን ፍላጎቱ አቅርቦትን በእጅጉ ይበልጣል፣ ቫውቸሮች በእያንዳንዱ የተለቀቀ ዙር በደቂቃዎች ውስጥ ይጠየቃሉ።
- የዴንቨር ሙቭስ ኔትወርክን (Denver Moves network) ሙሉ በሙሉ መገንባት። የከተማዋ የራሷ እቅድ 230+ አዲስ ማይሎችን ይፈልጋል። የገንዘብ ድጋፍ አድርጉ እና የ20-አመት ምኞት ሳይሆን በተፋጠነ የጊዜ መስመር ላይ ይገንቡት።
- 73% የዴንቨር ቤተሰቦች ከአንድ ሩብ ማይል ርቀት ላይ ይገኛሉ (DOTI, 2022)። በሞንትቤሎ፣ ፋር ሰሜን ምስራቅ፣ ምስራቅ ዴንቨር እና ካፒቶል ሂል ያሉትን ክፍተቶች በመዝጋት 100% ይድረሱ።
3. ቪዥን ዜሮ (Vision Zero) በህግ ማስከበር
የዴንቨር ቪዥን ዜሮ ፕሮግራም ግብ አለው እንጂ ስትራቴጂ የለውም። ከተማዋ በአላሜዳ ጎዳና ላይ ያለውን የመስመር አደረጃጀት ስትወያይ በ2025 በዴንቨር ጎዳናዎች ላይ ዘጠና ሶስት ሰዎች ሞተዋል። እውነተኛ ቪዥን ዜሮ የሚከተሉትን ይጠይቃል።
- ከፍተኛ የብልሽት መገናኛዎች ውስጥ ከፍተኛ 20ዎቹን እንደገና መንደፍ የተረጋገጡ የደህንነት ህክምናዎችን በመጠቀም፡ የእግረኛ መንገዶችን ማራዘም፣ የተጠበቁ መገናኛዎች፣ ከፍ ያሉ የእግረኛ መንገዶች እና የተገደቡ የመታጠፊያ እንቅስቃሴዎች። የ I-70/Peoria መለዋወጫ ብቻ በ2024 103 አደጋዎችን አስተናግዷል።
- በትምህርት ዞኖች እና በመኖሪያ አካባቢዎች አውቶሜትድ የፍጥነት ማስከበር። ፍጥነት ይገድላል። አውቶሜትድ ማስከበር ያለዘር መድልዎ 24/7 ይሰራል።
- በመኖሪያ ሰፈሮች የ20 ማይል በሰአት የፍጥነት ገደብ፣ ለእግረኛ ደህንነት አሳሳቢ በሆኑ ከተሞች ውስጥ ያለው መደበኛ።
- ለእግረኛ ቅድሚያ የሚሰጥ የምልክት ጊዜ፡- የእግረኛ መራመጃ ክፍተቶች እና በ High Injury Network ላይ ረዘም ያለ የመሻገሪያ ጊዜያት።
- ለግጭት እና ለማምለጥ ዜሮ መቻቻል። የወሰነ የምርመራ ክፍል ማቋቋም። ግጭት እና ማምለጥ በአብዛኛው ዝቅተኛ ገቢ ባላቸው ሰፈሮች ውስጥ እግረኞችን ይገድላል።
4. የመኪና ማቆሚያ ማሻሻያ
ዴንቨር እ.ኤ.አ በነሐሴ 2025 ዝቅተኛ የመኪና ማቆሚያዎችን አስወግዳለች። አሁን የበለጠ ይሂዱ፡-
- ያለውን የመኪና ማቆሚያ ወደ መኖሪያ ቤት፣ የችርቻሮ ንግድ ወይም አረንጓዴ ቦታ እንዲቀየር መፍቀድ። ዴንቨር በቤቶች ሊሆኑ በሚችሉ የመሬት ላይ የመኪና ማቆሚያ ቦታዎች ተሸፍናለች።
- በከተማው መሀል በፍላጎት ላይ የተመሰረተ የመኪና ማቆሚያ ዋጋ፡- መጨናነቅን ለመቀነስ፣ ገቢ ለማመንጨት እና ለንግድ ስራዎች ቅድሚያ ለመስጠት በተያዘው ቦታ ላይ በመመስረት የሚስተካከሉ ዋጋዎች።
- አዲሶቹን ደንቦች ማስከበር። ዝቅተኛ የመኪና ማቆሚያዎች በወረቀት ላይ ጠፍተዋል። አበዳሪዎች እና ገንቢዎች አሁንም ከመልመዳቸው የተነሳ ከመጠን በላይ የመኪና ማቆሚያ ይገነባሉ። ከተማዋ ፕሮጀክቶች ማሻሻያውን እንዲጠቀሙ ለመርዳት መረጃዎችን፣ የቴክኒክ ድጋፍን እና ማበረታቻዎችን መስጠት አለባት።
- ማስረጃው ግልጽ ነው፡ የተዋቀረ የመኪና ማቆሚያ የመኖሪያ ቤት ወጪዎችን በአማካይ በ$50,000 ዶላር ይጨምራል (Brookings Institution)። የዴንቨር ዩኒቨርሲቲ ጥናት የመኪና ማቆሚያ ትዕዛዞችን ማስወገድ በዴንቨር የመኖሪያ ቤት ግንባታ በ12.5 በመቶ ሊጨምር እንደሚችል አረጋግጧል፣ በዓመት በግምት 460 ተጨማሪ ቤቶች። የኮሎራዶ ኢነርጂ ኦፊስ ማሻሻያው በአቅራቢያ ትራንዚት (Transit) ተስማሚ የመኖሪያ ቤት ልማት በ180% እንደሚጨምር ይገምታል።
5. በትራንዚት ላይ ያተኮረ ልማት
ዴንቨር የባቡር ጣቢያዎችን ገንብታለች። ከዚያም አብዛኞቹን የመኪና ማቆሚያ ቦታዎች ከበውባቸዋል። ያ በትራንዚት ላይ ያተኮረ ልማት ተቃራኒ ነው።
- ከባቡር ጣቢያዎች በግማሽ ማይል ርቀት ውስጥ ያሉትን ቦታዎች በሙሉ ለተደባለቀ አጠቃቀም፣ ከፍተኛ-ጥቅም ልማት ከፍ ማድረግ። ከባቡር ርቀት በቅርብ ርቀት ላይ ነጠላ ቤተሰብ ብቻ መኖር የለበትም።
- ከአንድ ሩብ ማይል የትራንዚት ጣቢያዎች ውስጥ ምንም የመኪና ማቆሚያ ዝቅተኛ የለም፣ በአዲሶቹ ህጎች በአብዛኛው የተገኘ; በህግ የተደነገገ እና ይጠብቁት።
- በትራንዚት ላይ ያተኮረ ልማት ተመጣጣኝ የቤቶች መስፈርቶች፡- ቢያንስ 20% ክፍሎች በ60% AMI በማንኛውም ልማት በቅርብ ትራንዚት የጥቅም ጉርሻ ይቀበላል።
- በእያንዳንዱ ጣቢያ የመጀመሪያ/የመጨረሻ ማይል መፍትሄዎች፡- የብስክሌት መጋሪያ ጣቢያዎች፣ የዴንቨር ኮኔክተር የማይክሮትራንዚት አገልግሎት፣ ደህንነቱ የተጠበቀ የብስክሌት ማቆሚያ እና የእግረኛ ማሻሻያዎች። የሞንትቤሎ ኮኔክተር ፍላጎትን አሳይቷል፣ በመጀመሪያው አመት በ$3.2 ሚሊዮን በጀት 5,200 ወርሃዊ ተሳፋሪዎችን አግኝቷል።
6. RTD ተጠያቂነት
RTD የክልል ኤጀንሲ ነው። ዴንቨር በቀጥታ መቆጣጠር አትችልም። ነገር ግን ዴንቨር የ RTD ትልቁ ከተማ፣ ትልቁ የተሳፋሪ ገበያ እና ጉልህ የገንዘብ ድጋፍ ምንጭ ነው። ከተማዋ ተጽእኖ አላት እና ልትጠቀምበት ይገባል።
- የተመረጠ የ RTD ቦርድ ማሻሻያ መደገፍ። የአሁኑ የተሾመ የቦርድ መዋቅር ዳይሬክተሮችን ከመራጮች ተጠያቂነት ያገለላቸዋል። ተሳፋሪዎች ድምጽ ይገባቸዋል።
- የአፈጻጸም መለኪያዎች በይፋዊ ሪፖርት፡- በሰዓቱ አፈጻጸም፣ በተሳፋሪዎች ብዛት፣ የአገልግሎት ድግግሞሽ እና የጥገና እጥረት፣ በየሩብ ዓመቱ በተደራሽ ቅርጸቶች ይታተማሉ።
- አገልግሎቱን ከመከሰቱ በፊት ወደነበረበት በ2020 እንደ ዝቅተኛ መነሻ ማደስ። RTD በ$1 ቢሊዮን ዶላር መጠባበቂያ አገልግሎት መቁረጥ የለበትም። በሞንትቤሎ፣ ዌስትዉድ እና ሩቅ ሰሜን ምስራቅ ያሉ ተሳፋሪዎች ቃል የተገቡላቸውን መስመሮች ይገባቸዋል።
- ለአገልግሎት ድጋፍ የተወሰነ የከተማ ግንኙነት ወደ RTD፣ ከፍተኛ የከተማ ባለስልጣን ስራው በእያንዳንዱ የ RTD ቦርድ ስብሰባ ላይ ለዴንቨር ተሳፋሪዎች መታገል ነው።
7. የ15-ደቂቃ ከተማ ማዕቀፍ
የ15-ደቂቃ ከተማ ጽንሰ-ሀሳብ ቀላል ነው፡ እያንዳንዱ ነዋሪ የዕለት ተዕለት አስፈላጊ ነገሮችን (የግሮሰሪ መደብሮች፣ ትምህርት ቤቶች፣ መናፈሻዎች፣ የጤና እንክብካቤ፣ ትራንዚት እና የስራ ቦታ) በ15 ደቂቃ የእግር ወይም የብስክሌት ጉዞ ውስጥ መድረስ መቻል አለበት። ይህ የዩቶፒያን እይታ አይደለም። ከመኪና ያተኮረ እቅድ ሊደረስባቸው የሚችሉ ሰፈሮችን ከማፍረሱ በፊት ከተሞች የተገነቡት በዚህ መንገድ ነው። ዴንቨር ይህንን እንደ አስገዳጅ የእቅድ ማዕቀፍ መቀበል አለባት እንጂ እንደ ምኞት ብቻ አይደለም።
በዴንቨር ያለው ክፍተት የዴንቨር ሰፈሮች በየቀኑ ለሚያስፈልጉ ነገሮች ተደራሽነት እጅግ በጣም እኩል አይደሉም። የካፒቶል ሂል፣ የዋሽ ፓርክ እና የሃይላንድስ ነዋሪዎች ሊደረስባቸው በሚችሉ፣ በተቀላቀለ አጠቃቀም ሰፈሮች ውስጥ ብዙ ትራንዚት፣ የችርቻሮ ንግድ እና አገልግሎቶች ይኖራሉ። የሞንትቤሎ፣ የግሪን ቫሊ ራንች፣ የሩቅ ሰሜን ምስራቅ እና የዌስትዉድ ነዋሪዎች የምግብ በረሃዎች፣ የትራንዚት በረሃዎች እና ተጨባጭ አማራጭ የሌለው በመኪና ላይ የተመሰረተ አካባቢ ይገጥማቸዋል። የ15-ደቂቃ ከተማ ማዕቀፍ ይህንን እኩልነት የሚታይ እና የሚለካ ያደርገዋል፣ እና ክፍተቱን ለመዝጋት ቁርጠኝነትን ይፈጥራል።
ዴንቨር ምን ማድረግ አለባት
- የ15-ደቂቃ ከተማ ኦዲት፡- እያንዳንዱን የዴንቨር ሰፈር በስድስት አስፈላጊ ምድቦች ላይ መደበኛ የ15-ደቂቃ የእግር ጉዞ/የብስክሌት ጉዞን መቃወም፡ ግሮሰሪ/ምግብ፣ ትምህርት ቤቶች/የህፃናት እንክብካቤ፣ መናፈሻዎች/መዝናኛ፣ የጤና እንክብካቤ፣ ትራንዚት እና የስራ ማዕከላት። ውጤቱን በዘር እና በገቢ ፍትሃዊ መለኪያዎች የህዝብ ዳሽቦርድ አድርጎ ማተም [REVIEW: Does “equity metrics” translate well here?]።
- በአገልግሎት አነስተኛ በሆኑ አካባቢዎች ውስጥ መሙላት እና የተቀላቀለ-አጠቃቀም ዞን፡- በአሁኑ ጊዜ በመኖሪያ አካባቢዎች ብቻ የሆኑ የሰፈር-ልኬት የንግድ አጠቃቀሞችን (ግሮሰሪ፣ ፋርማሲ፣ ካፌ፣ የህፃናት እንክብካቤ) በሩቅ ሰሜን ምስራቅ፣ ሞንትቤሎ፣ ግሪን ቫሊ ራንች እና ዌስትዉድ መፍቀድ። ነዋሪዎች ግሮሰሪ ለመግዛት መኪና አያስፈልጋቸውም።
- በእያንዳንዱ ሰፈር ውስጥ ሙሉ ጎዳናዎች፡- እያንዳንዱን የጎዳና ዳግም ዲዛይን ወይም ዳግም ማስፋፋት የእግረኛ እና የብስክሌት መሻሻልን ማካተት አለበት። ከዚህ በኋላ የመኪና-ብቻ መሠረተ ልማት አይገነባም።
- የሰፈር አገልግሎት ማዕከላት፡- የከተማ አገልግሎቶችን (ቤተ መፃህፍት፣ የመዝናኛ ማዕከል፣ የጤና ክሊኒክ፣ የትራንዚት ማቆሚያ) በእግር ሊደረስባቸው በሚችሉ የሰፈር ማዕከላት ውስጥ ማስቀመጥ እንጂ በመኪና ማቆሚያ በተከበቡ ገለልተኛ ነጠላ አገልግሎት መስጫ ቦታዎች አይደለም። ተሻጋሪ ማጣቀሻ፡ Food Access & Urban Agriculture, Parks, Recreation & Public Space, Healthcare as a Right.
- የእግረኛ-የመጀመሪያ ጎዳና ንድፍ፡- የእግረኛ መንገዶችን ማስፋት፣ የጎዳና ዛፎችን መጨመር እና የንግድ ኮሪደሮች ውስጥ የእግረኛ ፕላዛዎችን መፍጠር፣ በተለይም በእግር መሄድ በአሁኑ ጊዜ በሰፊው፣ በፍጥነት በሚንቀሳቀሱ ጎዳናዎች ምክንያት ጠላት በሆነባቸው ሰፈሮች ውስጥ።
ለ15-ደቂቃ ማዕቀፍ ዓለም አቀፍ ማስረጃ
| ከተማ | ተነሳሽነት | ውጤት |
|---|---|---|
| ፓሪስ, ፈረንሳይ | ከንቲባ አን ሂዳልጎ “ville du quart d’heure”፡ የመኪና መንገዶችን ወደ የብስክሌት መንገዶች መቀየር፣ የሰፈር ፕላዛዎችን መፍጠር፣ 170,000 ዛፎችን መትከል እና የከተማ አገልግሎቶችን ወደ አካባቢ ሰፈሮች ማዕከላዊ አለማድረግ። | እ.ኤ.አ ከ2001 ጀምሮ በፓሪስ የመኪና ትራፊክ 60% ቀንሷል። በ2019-2024 መካከል የብስክሌት ጉዞዎች በሶስት እጥፍ ጨምረዋል። የአየር ጥራት በከፍተኛ ሁኔታ ተሻሽሏል። ሂዳልጎ በመድረኩ ላይ እንደገና ተመረጠች። |
| ሻንጋይ, ቻይና | 4.8 ሚሊዮን ነዋሪዎችን በ15 ደቂቃ የብስክሌት ጉዞ ውስጥ ከሁአንግፑ ወንዝ ጋር የሚያገናኙ 50 ኪ.ሜ አዲስ መንገዶችን ጨምሯል። | ቀደም ሲል በመኪና መሠረተ ልማት ለተቋረጡ ነዋሪዎች ወደ የውሃ ዳርቻ መድረስ ከፍተኛ ጭማሪ። |
| ሲድኒ, አውስትራሊያ | ቀደም ሲል የከተማው በጣም የተጨናነቀ ጎዳና የነበረውን ጆርጅ ጎዳናን እንደ ሰዎች ማዕከል ያደረገ የሕዝብ ቦታ አድርጎ በድጋሚ ነደፈች። | አሁን በሰዓት 8,000 ትራንዚት ተሳፋሪዎችን ያንቀሳቅሳል። የእግረኛ ትራፊክ በከፍተኛ ሁኔታ ጨምሯል። በጎዳናው ላይ የችርቻሮ ንግድ አደገ። |
| ኢንዲያናፖሊስ, አሜሪካ | በከተማው መሀል የብስክሌት መሠረተ ልማት ላይ $27 ሚሊዮን ዶላር ኢንቨስት አድርጓል። | በ$170 ሚሊዮን ዶላር የግል መኖሪያ ቤት እና የንግድ ልማት ላይ ተጽዕኖ አሳድሯል። 70% ነዋሪዎች የበለጠ የአካል ብቃት እንቅስቃሴ እንደሚያደርጉ ይናገራሉ። የከተማው ገቢ በሁለት ሶስተኛ ጨምሯል። |
| ሜልቦርን, አውስትራሊያ | የ20-ደቂቃ የሰፈር ፖሊሲ፡ ሁሉም አዲስ ልማት ለሚያስፈልጉ አገልግሎቶች የእግረኛ ደረጃዎችን እንዲያሟላ የሚጠይቅ ግልጽ የእቅድ ማዕቀፍ። | እንደ ይፋዊ የሜትሮፖሊታን እቅድ ስትራቴጂ ጸድቋል። ሰፈሮች በ20-ደቂቃ መዳረሻ ይገመገማሉ እና ደረጃ ይደረግባቸዋል። የህዝብ ዳሽቦርድ እድገትን ይከታተላል። |
| ቦነስ አይረስ, አርጀንቲና | በእግረኛ መንገዶች ለመፍጠር በከተማው ትልቁ መደበኛ ያልሆነ ሰፈራ 27 የህዝብ ቦታዎችን አሻሽሏል። የመኖሪያ ቤቶችን እና የእግረኛ ኮሪደሮችን አስተዋውቋል። | በከተማው አነስተኛ አገልግሎት በሚያገኙ ማህበረሰብ ውስጥ ለአገልግሎቶች መዳረሻን ለውጧል። ለፍትሃዊነት ያተኮረ የ15-ደቂቃ ንድፍ ሞዴል። |
የ15-ደቂቃ ከተማ ስለ እንቅስቃሴ ገደብ አይደለም። ማንኛውም ሰው ተግባራዊ ህይወት ለመኖር መኪና እንዲኖረው እንዳይገደድ ማረጋገጥ ነው። በዴንቨር 81% መንገደኞች ብቻቸውን የሚነዱበት እና በዝቅተኛ ገቢ ያላቸው የትራንዚት በረሃዎች ከፍተኛ የትራንስፖርት ወጪ ሸክም የሚገጥማቸው ይህ ማዕቀፍ ፍትሃዊነትን ማስጠበቅ ግዴታ ነው።
ዓለም አቀፍ ማስረጃ፡ መኪኖች መልሱ አይደሉም
| ሀገር/ከተማ | ሞዴል | ውጤት |
|---|---|---|
| ኮፐንሃገን, ዴንማርክ | ለተጠበቀ የብስክሌት መሠረተ ልማት፣ ከተሞችን የሚያገናኙ የብስክሌት ሱፐርሀይዌይዎች፣ በፍላጎት ላይ የተመሰረተ የመኪና ማቆሚያ ዋጋ ላይ የብዙ አሥርተ ዓመታት ኢንቨስትመንት። | ሁሉም የሥራ ወይም የትምህርት ጉዞዎች 49% በብስክሌት ነው። 97% የብስክሌተኞች እርካታ። ከተማዋ በየዓመቱ ከብስክሌት 91 ሚሊዮን ዶላር በጤና እንክብካቤ ወጪ ትቆጥባለች። |
| ቶኪዮ, ጃፓን | በዓለም ላይ እጅግ በጣም ሰፊ የሆነ የከተማ የባቡር ኔትወርክ፡ 158 መስመሮች፣ 4,714 ኪ.ሜ ትራክ፣ የሜትሮ አካባቢን የሚያገለግሉ 2,210 ጣቢያዎች። | 40 ሚሊዮን ዕለታዊ የባቡር ተሳፋሪዎች። 99.8% በሰዓቱ አፈጻጸም። አንድ ባቡር ከ25 ሰከንድ ቀደም ብሎ በመነሳቱ በአደባባይ ይቅርታ የጠየቀ ትክክለኛ ሲስተም። |
| ካንሳስ ሲቲ, ሚዙሪ | በ2020 ሁሉንም የአውቶቡስ ዋጋዎችን አስወገደች፣ በአሜሪካ ውስጥ ዋጋ የሌለው ትራንዚት ያላት ትልቁ ከተማ። | ተሳፋሪዎች ከእኩዮቻቸው ከተሞች 24% ይበልጣል። 17% ተሳፋሪዎች ለአገልግሎቱ አዲስ ናቸው። 92% ወደ ስራ እና አስፈላጊ ነገሮች መድረስ መሻሻሉን ይናገራሉ። |
| ቦጎታ, ኮሎምቢያ | ከ 550 ኪ.ሜ የብስክሌት ኔትወርክ ጋር የተዋሃደ ትራንስሚሌኒዮ BRT (55 ኪ.ሜ)። ሳምንታዊ ሲክሎቪያ በየእሑድ 121 ኪ.ሜ ጎዳናዎችን ከመኪና ነፃ ያደርጋል። | እስከ 2 ሚሊዮን ሳምንታዊ የሲክሎቪያ ተሳታፊዎች። 900,000 ዕለታዊ የብስክሌት ጉዞዎች። የብስክሌት ፍጥነቶች (17 ኪሜ በሰዓት) የችኮላ ሰዓት ትራንዚትን (13 ኪሜ በሰዓት) ይመታ |